.png)
The summer of 2025 delivered grid volatility across PJM and ERCOT. A heat dome in late June caused a big rise in electricity demand. This reached levels not seen in ten years. Grid operators had to quickly respond with Coincident Peak (CP) alerts and calls for demand response.
For large commercial and industrial (C&I) users, like data centers and Bitcoin mining farms, these CP events were crucial. A single peak could decide a year’s worth of capacity charges.
In this blog, we’ll recap June–July 2025’s coincident peaks, load swings, price spikes, and how accurate power market forecasts using Arcus Power (with low MAPE and MAE) helped consumers dodge costly peak charges.
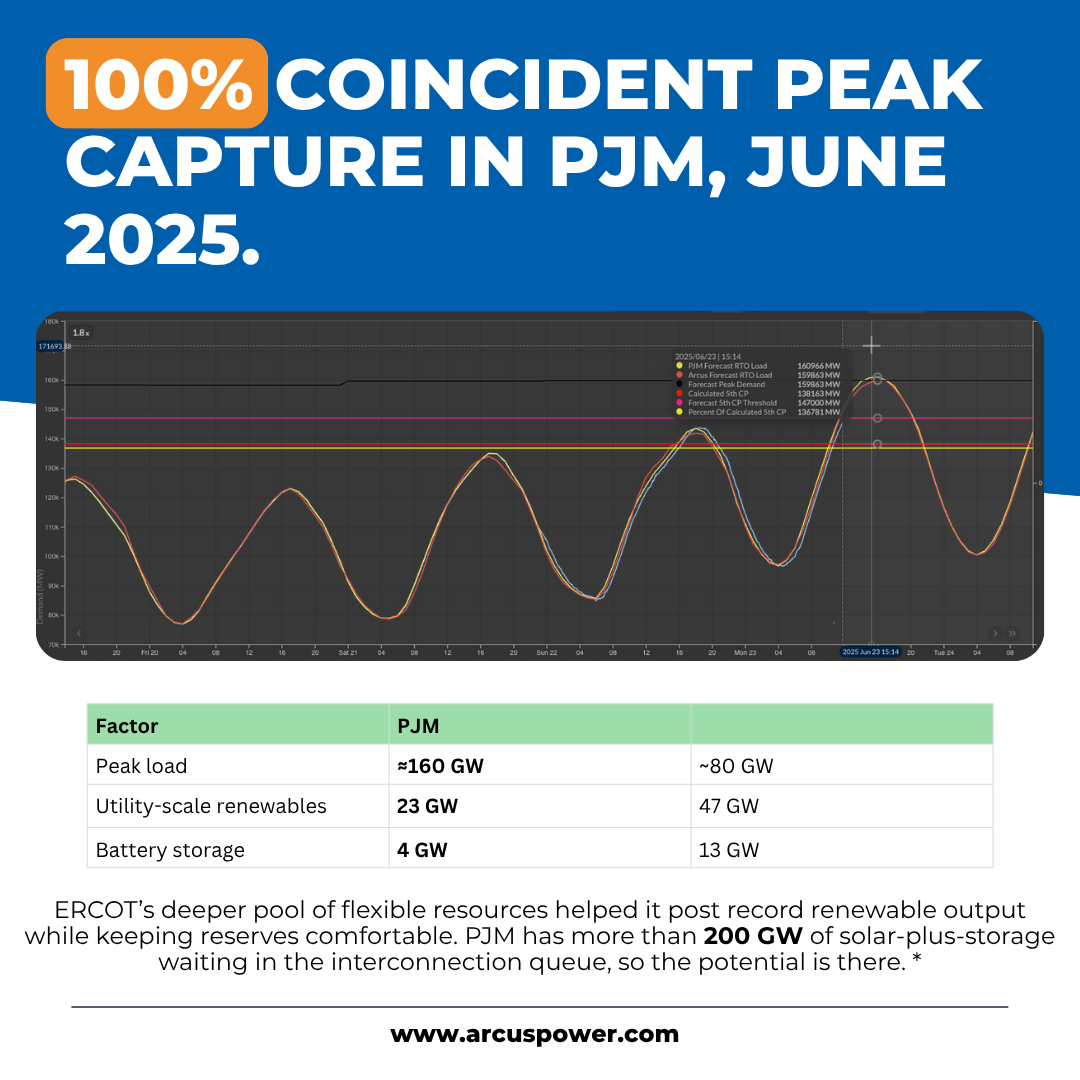
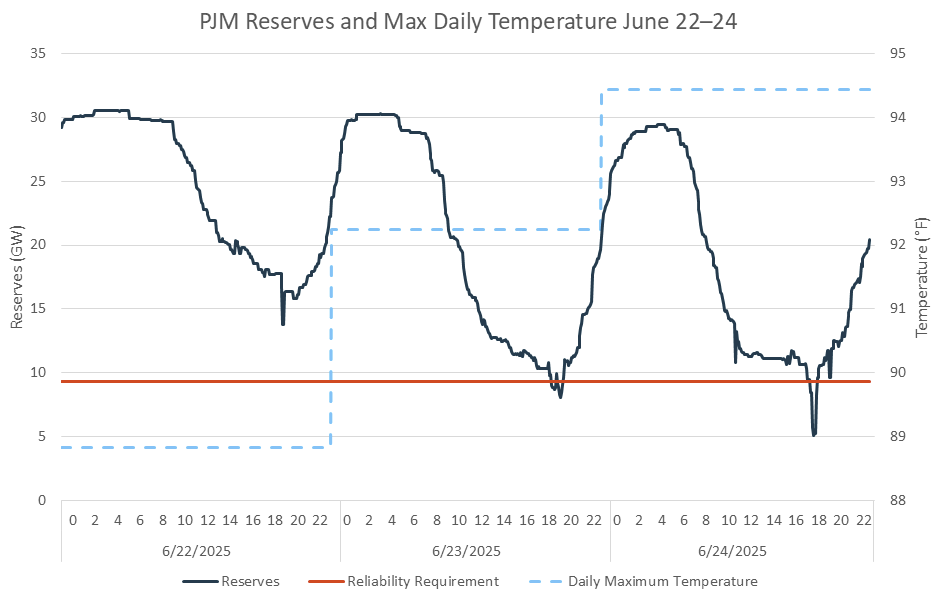
PJM: The Mid-Atlantic’s PJM Interconnection saw record-setting demand under historic heat. On June 23, PJM load peaked at 160,560 MW between 5–6 p.m., shattering the RTO’s summer forecast (154,000 MW) by over ~6 GW. This is the highest in over a decade – approached PJM’s all-time peak (165,563 MW set in 2006) and far exceeded normal June loads.
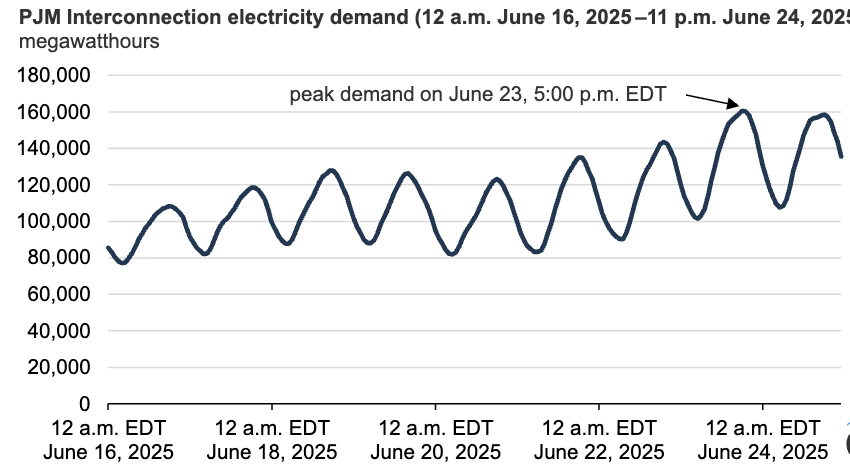
Real-time LMPs shot up: prices topped >$1,334/MWh at 7 p.m. on June 23 and hit upwards of $2,100/MWh the next day. Operating reserves reduced to a dangerous level. PJM’s required reserve margin (~9.3 GW) was undershot; on June 24 available reserves plunged to just 5 GW, triggering emergency protocols.
Aside from this late June event, July brought additional heat waves – PJM’s forecast on July 29 called for ~>158,000 MW peak demand. Actual peaks in late July neared the June records, albeit with slightly more supply cushion and milder price spikes (still reaching the mid-$200s/MWh in some zones by midday July 28.
PJM's summer reserve margins were tight, often below 15% during peak hours. Operators issued Max Generation Alerts into late July. High humidity and increased data center loads raised air-conditioning demand.
ERCOT: In Texas, the ERCOT grid also faced formidable summer loads, though supported by renewables and new capacity. Peak demand steadily climbed into the 80+ GW range.
ERCOT had projected 2025 peaks of ~82,200 MW in June and ~84,100 MW in July, on track toward a potential new all-time record in August.
Through June, the system set a new record for June energy usage, with daily peak loads averaging 74,766 MW.
Actual June peaks were a bit lower than expected. One notable time was on June 8. On that Sunday afternoon, demand reached about 77 GW. This shows that weekend demand can be as high as weekday demand in 2025.
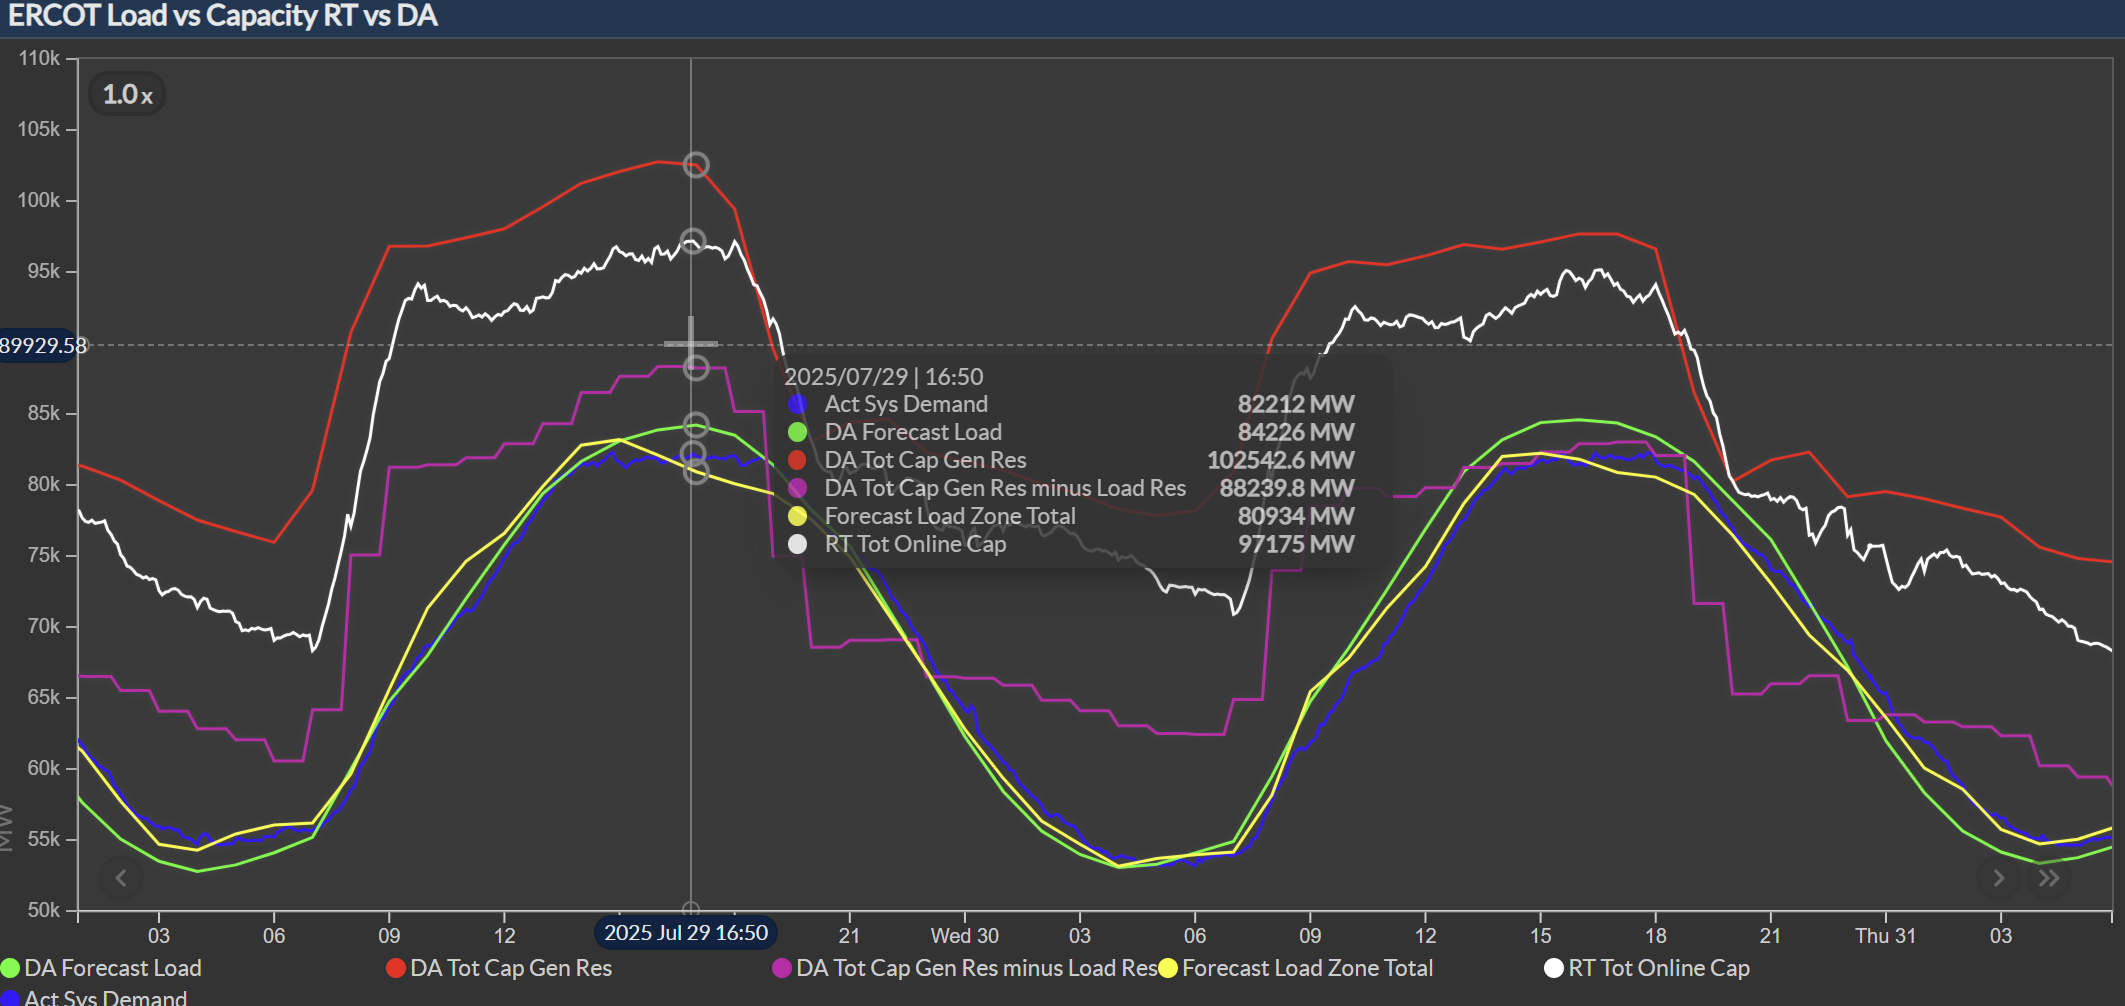
By late July, ERCOT’s top demand days were pushing the mid-80s GW; on July 29 the grid served an estimated 83–84 GW around the 4–5 p.m. window.
Crucially, ERCOT maintained sufficient reserves, avoiding any grid emergencies through July. The Operating Reserve Demand Curve (ORDC) kicked in on the hottest evenings, but prices generally stayed below the $5,000/MWh cap.
The highest real-time prices in June and July were in the low four-digit range for short times. This was much lower than PJM’s spike. The lower prices were due to plenty of solar energy and quick batteries. These kept the supply ahead of the sharp evening demand increase.
For example, on July 11, battery storage injected over 6,300 MW during the evening peak, covering about 9.2% of ERCOT’s demand at that moment and averting deeper scarcity.
Reserve margins in ERCOT thus remained healthier (often 10–15% or more) despite record heat, and the grid operator did not have to issue public conservation appeals through July (unlike some past summers).
Texas regulators were vigilant, however – ERCOT entered the season with Hot Weather Alerts and a strong supply cushion, adding ~5.4 GW of solar and ~3.8 GW of storage since 2024.
Identifying the 5CP Hours: PJM determines each customer’s capacity obligation based on the five highest peak-hour loads of the summer (the 5 CP hours) – and summer 2025 provided a dramatic case study. Between June 22 and 26, at least two of those five coincident peaks were delivered.
The #1 CP hour fell on June 23 (HE18) when PJM load hit ~160.6 GW at 5–6 p.m. The #2 CP came just a day later on June 24, with peak load ~158 GW (around 2.5 GW below the 23rd’s level) during the 6–7 p.m. hour.
These two back-to-back peaks occurred during an oppressive heat wave blanketing PJM’s footprint. Scorching temperatures (well into the 90s °F with high humidity) drove unprecedented air-conditioning usage, exceeding 2010s-era records.
Grid operators expected high demand. They predicted loads of 152 GW for June 23 and 155 GW for June 24. However, actual demand exceeded even the revised 90/10 forecasts, highlighting the difficulty in predicting extreme occurrences.
Several other probable CP days occurred later in the summer. One strong contender was July 28 or 29, when a broad heat wave over the Midwest/Mid-Atlantic pushed PJM’s load back up to ~158 GW.
On July 28, PJM expected ~155 GW, and by July 29 it aimed for ~160 GW – suggesting that July 29 (HE17–18) likely registered as another top-5 system peak. Indeed, many load management firms issued “5CP warning” alerts on those days.
By the end of July, PJM had likely recorded two of its five CP hours. Two were in late June and two in late July. A fifth hour might happen in August or early September, based on usual patterns.
Peak Load Values and Price Spikes: The CP hours in June came with eye-popping load and price stats. June 23’s 160+ GW was PJM’s highest summer load ever recorded since the 2000s and was 8.5 GW higher than the previous summer peak record (FactSet, Energy Insights blog).
June 24’s peak (~157–158 GW) was only slightly lower, yet real-time prices that day soared higher – peaking around $2,100/MWh in the D.C. area as reserve shortages grew acute (FactSet, PJM price spike report).
These prices reflected Operating Reserve Penalty (ORP) adders when PJM’s operating reserves fell below the requirement.
During the June 24 CP hour, reserves were depleted to roughly 5,000 MW (versus ~9,300 MW needed), forcing PJM to max out generation and tap emergency imports.
By contrast, the late-July CP events saw peak loads in the mid-150s GW and more moderate pricing. For example, on July 28–29 the PJM West Hub on-peak price was around $130–150/MWh, and the highest real-time LMPs briefly hit ~$270/MWh.
These still reflected tight conditions but not the near-shortage scenario of June. In short, PJM’s coincident peaks occurred on days of extreme weather stress, often aligning with operational constraints that amplified prices.
Weather and Grid Constraints: The dominant driver was clearly heat – persistent high temperatures across multiple days. But other factors affected the CP timing. The late-June heat dome coincided with generator derates and transmission outages that complicated operations.
PJM’s post-event review noted that some generators tripped or ran at reduced output due to the heat (thermal efficiency drops as ambient temps rise). Forced outages actually increased by ~1.2 GW from June 23 to 24, contrary to expectations that plants would come back online.
On the transmission side, PJM had to recall or reschedule numerous maintenance outages during June 22–26 to free up capacity.
There were limits in ATSI and APS areas on several days that week. These limits, along with big drops in customer load, sometimes pushed the peak hour a little later.
For example, on June 25–26, some utilities saw their local peak net loads occur in hour ending 17–18 instead of the typical 16–17, likely because proactive curtailments by C&I customers flattened the afternoon load profile until later.
Overall, weather extremes plus operational hiccups (like unexpected generator outages) made Summer 2025’s CP hours even more volatile in PJM.

Demand Response: Facing these peaks, PJM did not rely solely on price signals – it dispatched demand response (DR) resources for the first time in years during June’s events.
The RTO had issued a Hot Weather Alert before the heat wave, and by June 23 it escalated to a Maximum Generation Alert and Load Management Alert, calling on its registered DR capacity.
On June 23, PJM activated about 1,500 MW of pre-emergency DR in select Mid-Atlantic and Dominion zones. On June 24, with system conditions tighter, PJM dispatched all available DR programs RTO-wide, effectively a full demand response event.
These DR deployments shaved several hundred MW off the peak and “kept blackouts at bay” during the worst intervals. Many large customers (e.g. industrials) voluntarily curtailed usage as well, aiming to avoid coincident peak charges.
The impact of these load reductions is evident when comparing regions: for instance, American Electric Power (AEP)’s territory – with significant industrial load – saw its load plateau from 1 p.m. into the evening, rising only ~0.5 GW, whereas a more residential zone like ComEd (Chicago) saw a 1.6 GW surge over the same period.
This contrast showcases demand elasticity: where C&I consumers responded to CP warnings (flattening AEP’s curve), residential-heavy areas peaked normally.
By July’s CP days, PJM had less need for emergency DR (the late July peaks were high but manageable); however, many participants had learned from June and took early action to cut load on forecasted peak afternoons.
In summary, Summer 2025 showed that avoiding the 5 CP hours needs quick actions. PJM’s events highlighted the benefits of both formal DR programs and voluntary conservation in reducing peak demand.
4CP Basics: ERCOT’s 4 Coincident Peak (4CP) program identifies the single highest 15-minute demand interval in each summer month (June–Sept). Large users’ transmission charges (TDSP fees) for the next year are based on their average demand during those four monthly peak intervals.
Thus, every summer day from June through September, especially late afternoons, is a waiting game for big Texas power consumers trying to predict and avoid the next 4CP interval.
Summer 2025 has been no exception – in fact, ERCOT anticipated all four months of June–Sept would exceed 80 GW demand, making 4CP avoidance a high priority for many firms.
June 2025 4CP: The likely 4CP interval for June occurred during the intense late-June heat. Early in the month, an “obvious” peak on June 2 (when operational load briefly spiked into the low 70s GW) was surpassed by a higher net-load peak on June 8. Interestingly, June 8 was a Sunday – yet around 4:45–5:00 p.m. on 6/8, ERCOT’s settlement-adjusted load (which subtracts large battery charging) edged out all other June intervals.
This unusual outcome (weekend peak) was attributed to battery storage behavior. On weekday afternoons with high solar output, some batteries were charging, which actually reduced “net” demand in the settlement data. But on Sunday June 8, with slightly lower solar generation and perhaps different charging patterns, the operational peak ~77 GW translated into the highest 4CP load after adjustments.
Many market participants initially thought a later date (e.g. June 27 around 5 p.m., when ERCOT’s load peaked near 79–80 GW) was the 4CP, but settlement data confirmed June 8 as the official June CP interval in a twist reminiscent of 2024’s surprises.
The bottom line: a perfect storm of high demand plus minimal storage charging made June 8 (HE17) the top interval. That 15-minute period will count as June’s contribution to everyone’s 4CP average for 2025.
July 2025 4CP: For July, the frontrunner is more straightforward. By July’s end, ERCOT’s highest demand was reached on July 29 during HE17 (4:00–5:00 p.m. hour). ERCOT’s day-of projection was ~84 GW, and the grid came very close to that – unofficial operational data showed a peak around 83.5 GW just before 5 p.m. on 7/29.
Unless August or September produce an even higher interval (which they might), July 29, 2025 is likely to stand as one of this year’s four CP markers. Runners-up in July included July 18 (~81 GW) and July 28 (~82 GW), but those came in slightly lower.
It’s worth noting that real-time vs. day-ahead deviations were at play: for example, on July 29, ERCOT’s day-ahead market and system operators were prepared for ~84 GW, and the real-time came within 0.5–1% of that – a solid forecasting performance.
Significance for TDSP Charges: These 4CP intervals carry huge financial weight for large Texas customers. Each TDSP (Transmission/Distribution Service Provider) calculates a user’s contribution to the four CPs, and those values set the transmission charge portion of bills for the entire next year. Essentially, if you can drop to near-zero usage during each monthly peak, you significantly lower your demand-based charges (often saving tens or hundreds of thousands of dollars).
Conversely, guessing wrong – e.g. not curtailing during the true 4CP interval means you’ll pay a hefty share of the grid’s costs. This dynamic creates a kind of cat-and-mouse game each afternoon.
In June and July 2025, we saw an extreme version of this: many crypto-mining operations and data centers strategically cut load during likely peak windows. In fact, several Texas Bitcoin miners reported substantial production declines in June because they powered down around peak hours.

Accurate power market forecasts were essential in Summer 2025’s volatility – both for grid operators managing reliability and for consumers planning hedges and curtailments. Here we compare how Arcus Power’s forecasting performed versus public ISO forecasts, using metrics like MAPE (Mean Absolute Percentage Error) and MAE (Mean Absolute Error) to quantify accuracy.
ERCOT has officially released the June Preliminary Coincident Peak (CP) interval, and Analyst team is excited to share that our high-probability forecast successfully captured it! Even better, our proxy (CP Estimated Stream) was remarkably close to ERCOT’s reported Net System Demand, despite all underlying uncertainties and unpredictable huge curtailments.
🔹 ERCOT's official CP interval was June 19th at interval ending 17:00, with a reported Net System Demand of 77,453 MW.
🔹 Our live estimation showed 77,423 MW at 16:45 and 77,403 MW at 17:00—an exceptional alignment! What’s even more notable is how challenging ERCOT has become this year. For context:
This outcome shows how effective ERCOT’s demand management strategies are. It also highlights the accuracy of our estimation model. This is important, especially as predicting ERCOT’s CP intervals gets harder.
Analyzing Summer 2025’s peaks in PJM and ERCOT side by side yields insights into demand elasticity, price volatility, renewables, and storage in these two massive power markets.
Demand Elasticity and Peak Shaving: ERCOT’s consumer base includes a growing share of highly flexible load (crypto miners, flexible industrials) that actively responds to price and CP signals. This was evident as bitcoin miners and others cut demand sharply during 4CP intervals, sometimes preventing a peak from being as high as it would’ve been.
In PJM, while some large customers curtailed during CP hours, the overall demand elasticity is lower – many peaks are driven by widespread residential/commercial AC usage that is less price-responsive (absent an emergency alert).
We saw in PJM’s case that regions with more C&I load (with CP programs or interruptible tariffs) had flatter peak load profiles than predominantly residential regions. This difference in elasticity means ERCOT’s peak demand can be a moving target (if enough load drops off at a critical moment, the “peak” could occur at a different time or lower level).
PJM’s peaks, on the other hand, tend to be a bit more inelastic and thus reflective of underlying weather-driven demand. For instance, ERCOT’s highest operational load didn’t always equate to highest settled CP load due to big loads avoiding that moment, whereas PJM’s top five hours simply were the hottest hours with everyone cranking the AC.
Price Volatility: Both markets saw volatility, but the magnitude and causes differed. PJM experienced extreme price spikes – reaching ~$2,000/MWh under reserve shortages – showing scarcity pricing when supply struggled to meet surging demand. These spikes were short-lived but dramatic, indicating that PJM’s capacity cushion was thin on those peak hours (leading to ORDC-like penalties).
ERCOT’s price volatility in June–July was comparatively muted. Prices certainly spiked (e.g. into the high hundreds $/MWh on some evenings, and a few intervals possibly exceeding $1,000), but thanks to ample reserves and quick-trigger battery response, ERCOT avoided the type of emergency price spike seen in PJM.
Moreover, ERCOT’s ORDC mechanism has a more gradual price adder curve; during July 11’s evening when ~5 GW of coal was unexpectedly out, batteries and conservation stepped in and kept the reliability metric (PRC) from dropping to critical lows. The result: prices in ERCOT maybe hit ~$500–700/MWh rather than thousands.
In PJM, however, the combination of less battery capacity and slower demand response meant the last few MW of load led to huge price jumps.
This indicates ERCOT’s investments in energy storage and responsive load are paying off in terms of price stability. It’s also a function of market design: PJM and other Eastern RTOs have administratively determined scarcity pricing adders that can spike very high once reserves dip below a threshold, whereas ERCOT’s ORDC gradually increases the price as reserves tighten, potentially avoiding some shock spikes until reserves are extremely low.
In summary, PJM vs ERCOT in Summer 2025 reveals a tale of two grids: PJM faced more rigid demand and scarcer reserves, leading to dramatic price spikes and emergency DR calls, while ERCOT leveraged flexible demand and a surge of renewables/storage to manage very high loads with fewer fireworks. Both saw record or near-record coincident peaks, but the approaches to meeting those peaks differed – a valuable lesson in the importance of resource mix and demand-side participation.
Summer 2025 was a crucible for power market participants – an intense preview of the future where accurate forecasting and agile response determine winners and losers. PJM’s and ERCOT’s CP events demonstrated that even in well-supplied grids, weather can strain resources and send costs surging. Yet, we also saw how informed, proactive consumers could turn this volatility into opportunity: avoiding peak charges, capitalizing on price arbitrage, and supporting grid reliability.
At Arcus Power, we are proud to have helped our clients steer through this turbulence. With our data-driven power market forecasts and real-time tools, Arcus issued timely alerts that enabled companies to act – whether that meant firing up backup gensets ahead of a coincident peak or adjusting pre-scheduled hedges in the day-ahead market.
We believe that these big peaks don’t have to cause chaos. With good analytics, like low MAPE load forecasts, and a strong action plan, C&I consumers can manage even rare events. This includes events like those we experienced in June–July 2025.
Arcus will continue to refine its models and dashboards as we head into late summer, helping you decipher evolving trends – be it demand growth from new data centers or the reliability impact of the next gigawatt of batteries.
Explore our solutions to unlock market opportunities and manage risks effectively.
Get Started.png)

Shifting Assets For Data Center Energy Management

Arcus Power Announces Patrick Smith as VP of Technology to Accelerate AI Energy Innovation

Breaking down how Arcus’s high-probability approach made capturing IESO GA peaks possible