.png)
ERCOT has moved through January to July with steady load growth, evening tightness, and a dispatch stack that relied on gas to backstop weaker summer wind. Prices behaved less like single-day blowouts and more like clusters of short scarcity intervals. July’s Coincident Peak landed at 81,707 MW after visible curtailment and demand response. Average monthly hub prices stayed in the mid-30s / MWh with brief real-time spikes. Also, Solar set new new records. Wind recovered at times but lagged in the hottest hours. The forward risk sits squarely in August and September, where record peaks are still in play and ORDC can lift prices in early evening. We're broken down this in detail below:
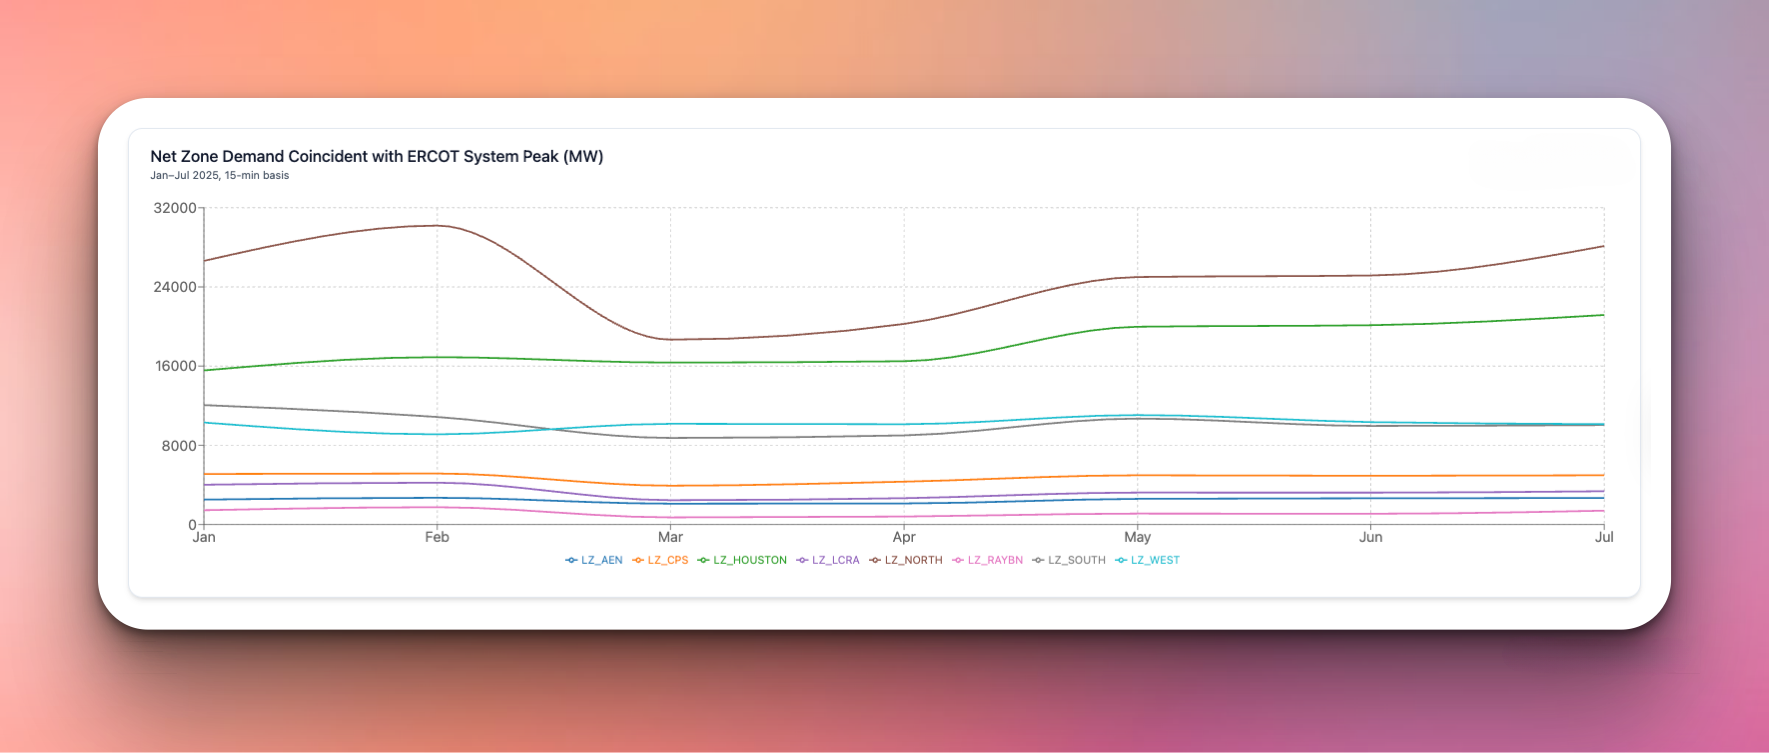
January’s system peak reached about 77,482 MW during a morning cold snap. February topped that at about 80,560 MW as heating due to low temperatures pulled the curve higher. Both months showed short periods of tight reserves followed by quick normalization.
March and April settled into low-to-mid 60s GW peaks. These months formed the seasonal trough. Wind contributed well on several days, which helped keep reserves comfortable and prices stable outside a few congestion intervals.
May pushed back to roughly 78,399 MW. June followed at about 77,351 MW. The sustained heat and long evening ramps began to matter more than mid-day highs. ORDC adders showed up when wind was light and solar fell off.
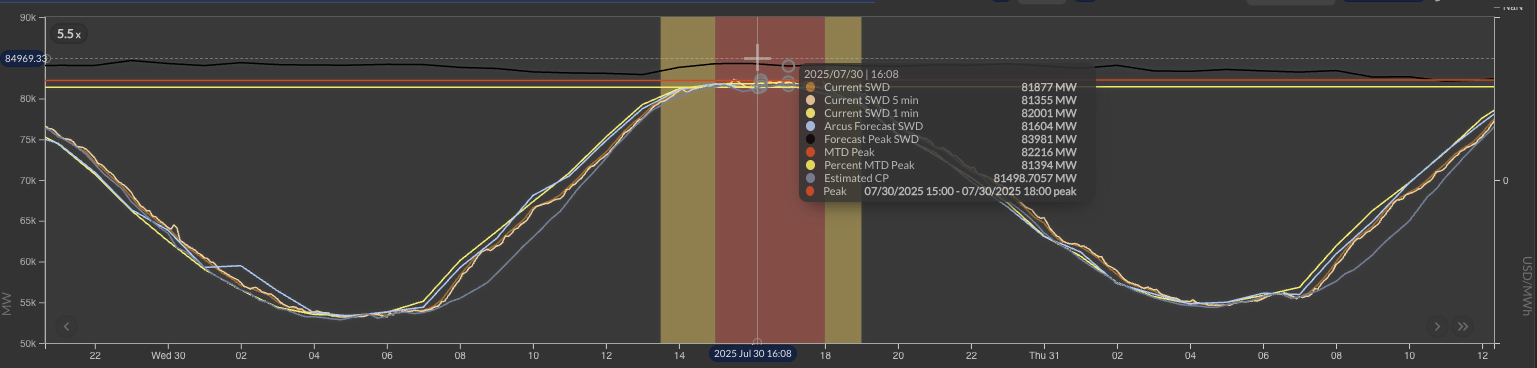
ERCOT set the month’s high at 81,707 MW. This was the classic late-month heat, with repeated day-over-day highs and evening reserve margins that skimmed the threshold where scarcity pricing comes up. Arcus Power’s post-month analysis shows 14 days in July set a new month-to-date peak as temperatures climbed through the month. The final CP occurred at 5:45 pm, later than typical but still within the window.
The 2025 curve differs from 2024. Last year’s early summer peak faded quickly. This year rose more gradually but held tight for longer evening stretches. That matters for hedging structure and for operational readiness on the tight days.
July’s hub averages printed near $35/MWh in DAM and $33/MWh in RTM. Spikes appeared mid-month in real time and at month end in day-ahead, including on the CP day. This matched the pattern we have watched all year: moderate scarcity bursts that cluster around the early-evening ramp.
Instead of rare, towering peaks, 2025 delivered more frequent short intervals in the hundreds of dollars as gas units set marginal prices after sunset. Clusters were long enough to lift on-peak averages, but not long enough to dominate the month.
West discounted when wind was strong and flipped when wind under-delivered into high coastal load. Houston held a premium during the hottest afternoons. Congestion risk between West and coastal hubs presented tradable spreads on days with weak wind and heavy cooling.
ORDC remained the quiet driver. It did not require a crisis to matter. Evening reserves fell often enough to add dollars at the margin and to force attention on 1 to 3 hour price windows rather than only on “the big day.”
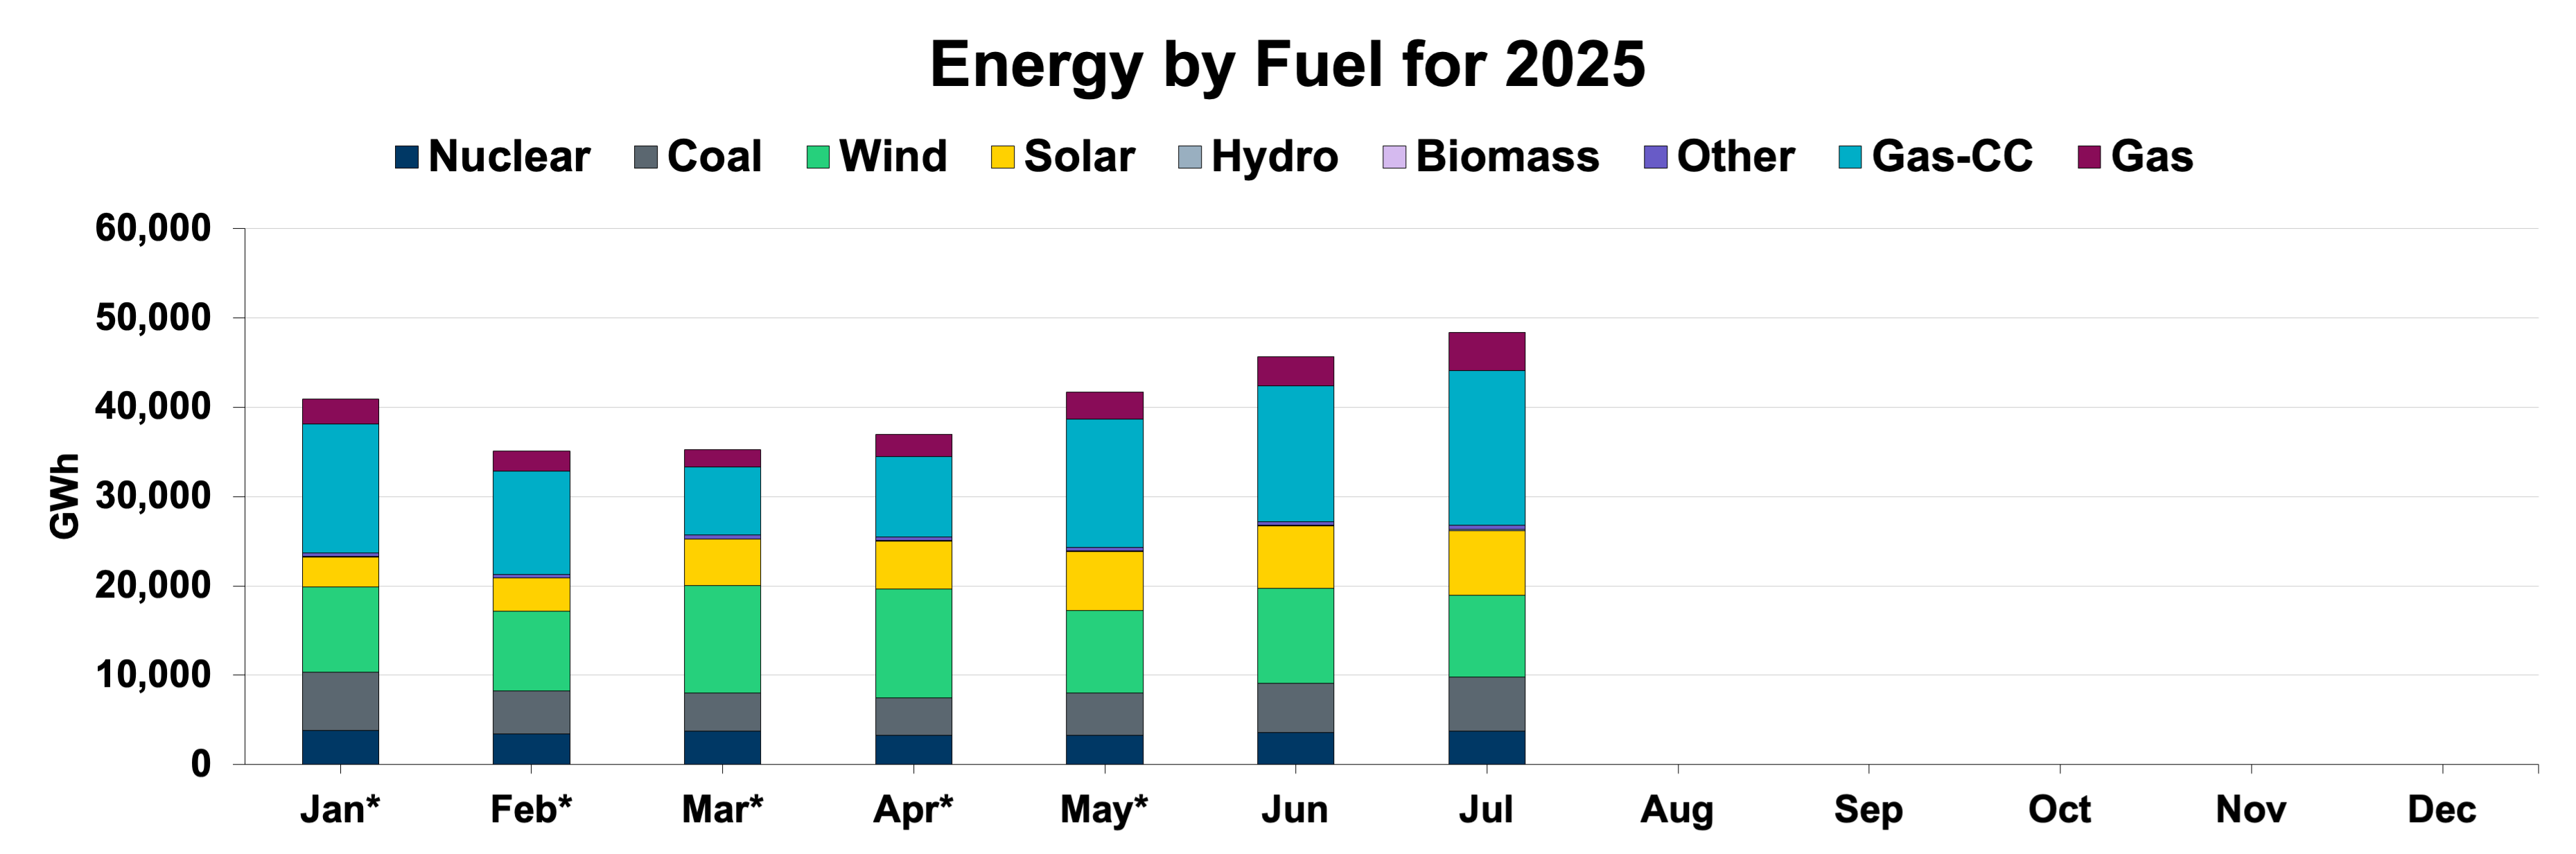
Gas remained the balancing anchor from January through July. Combined-cycle share ran roughly a quarter to a third of monthly energy and lifted further during evening scarcity. Peakers set price in the post-solar hours.
Output was strongest in March and April, then eased seasonally in June and July. July still reached peaks near 27,000 MW and averaged roughly 2,000 MW more than July 2024, yet the timing of wind was often misaligned with evening demand.
Solar set new records with peaks near 29,000 MW, averaging about 3,000 MW higher than July 2024. Midday prices were tamer on high-solar days. The drop after 6 pm continued to be the stress point for reserves and LMPs.
Coal stayed small and price sensitive. Nuclear held steady and provided inertia support. Neither altered the ramp dynamics that drive scarcity risk.
This fuel mix solved reliability most days, yet it left a clear exposure. Without storage or other flexible resources that sit in the 4 to 6 pm bridge, the system leans hard on gas and ORDC to get through the evening. That is workable. It is also where the price risk lives.
Arcus Power’s July post-month CP report fills in important details and challenges a few assumptions.
ERCOT’s initial July peak forecast was 87,532 MW. Actual CP printed 81,707 MW. The gap was substantial and not a model artifact. It reflected demand response, curtailment, and behind-the-meter generation that cut the peak by about 6.66 percent. Curtailment volumes were often 3,000 MW and on some days approached 5,000 MW. ERCOT’s forecast CP ran about 6,000 MW higher than what showed up in real time.
Heat built through the month. Fourteen separate days set a new month-to-date high before the final CP. The CP interval hit at 5:45 pm, later than the classic 4:30 to 5:30 pocket but consistent with the longer, hotter evenings this summer.
Monthly averages were tame, yet we still saw brief RTM spikes mid-month and some high DAM prices at month end, including on the CP day. The lesson is clear. Average monthly prices can look calm while short scarcity bursts carry the risk and revenue.
Arcus’ CP demand model identified the ERCOT CP call as the single highest 15-minute interval of the month and aligned with ERCOT’s call. The difference between the Arcus hourly CP calculation and ERCOT’s posted hourly preliminary value was 0.04 percent, which is essentially a match. That precision matters for DR triggers and for risk desks that size same-day exposure.
Takeaway
Curtailment and DR moved the system peak in a measurable way. That reshapes how we read ERCOT’s public forecasts. You need a view on behind-the-meter and response behavior or you will systematically over-estimate realized peak.
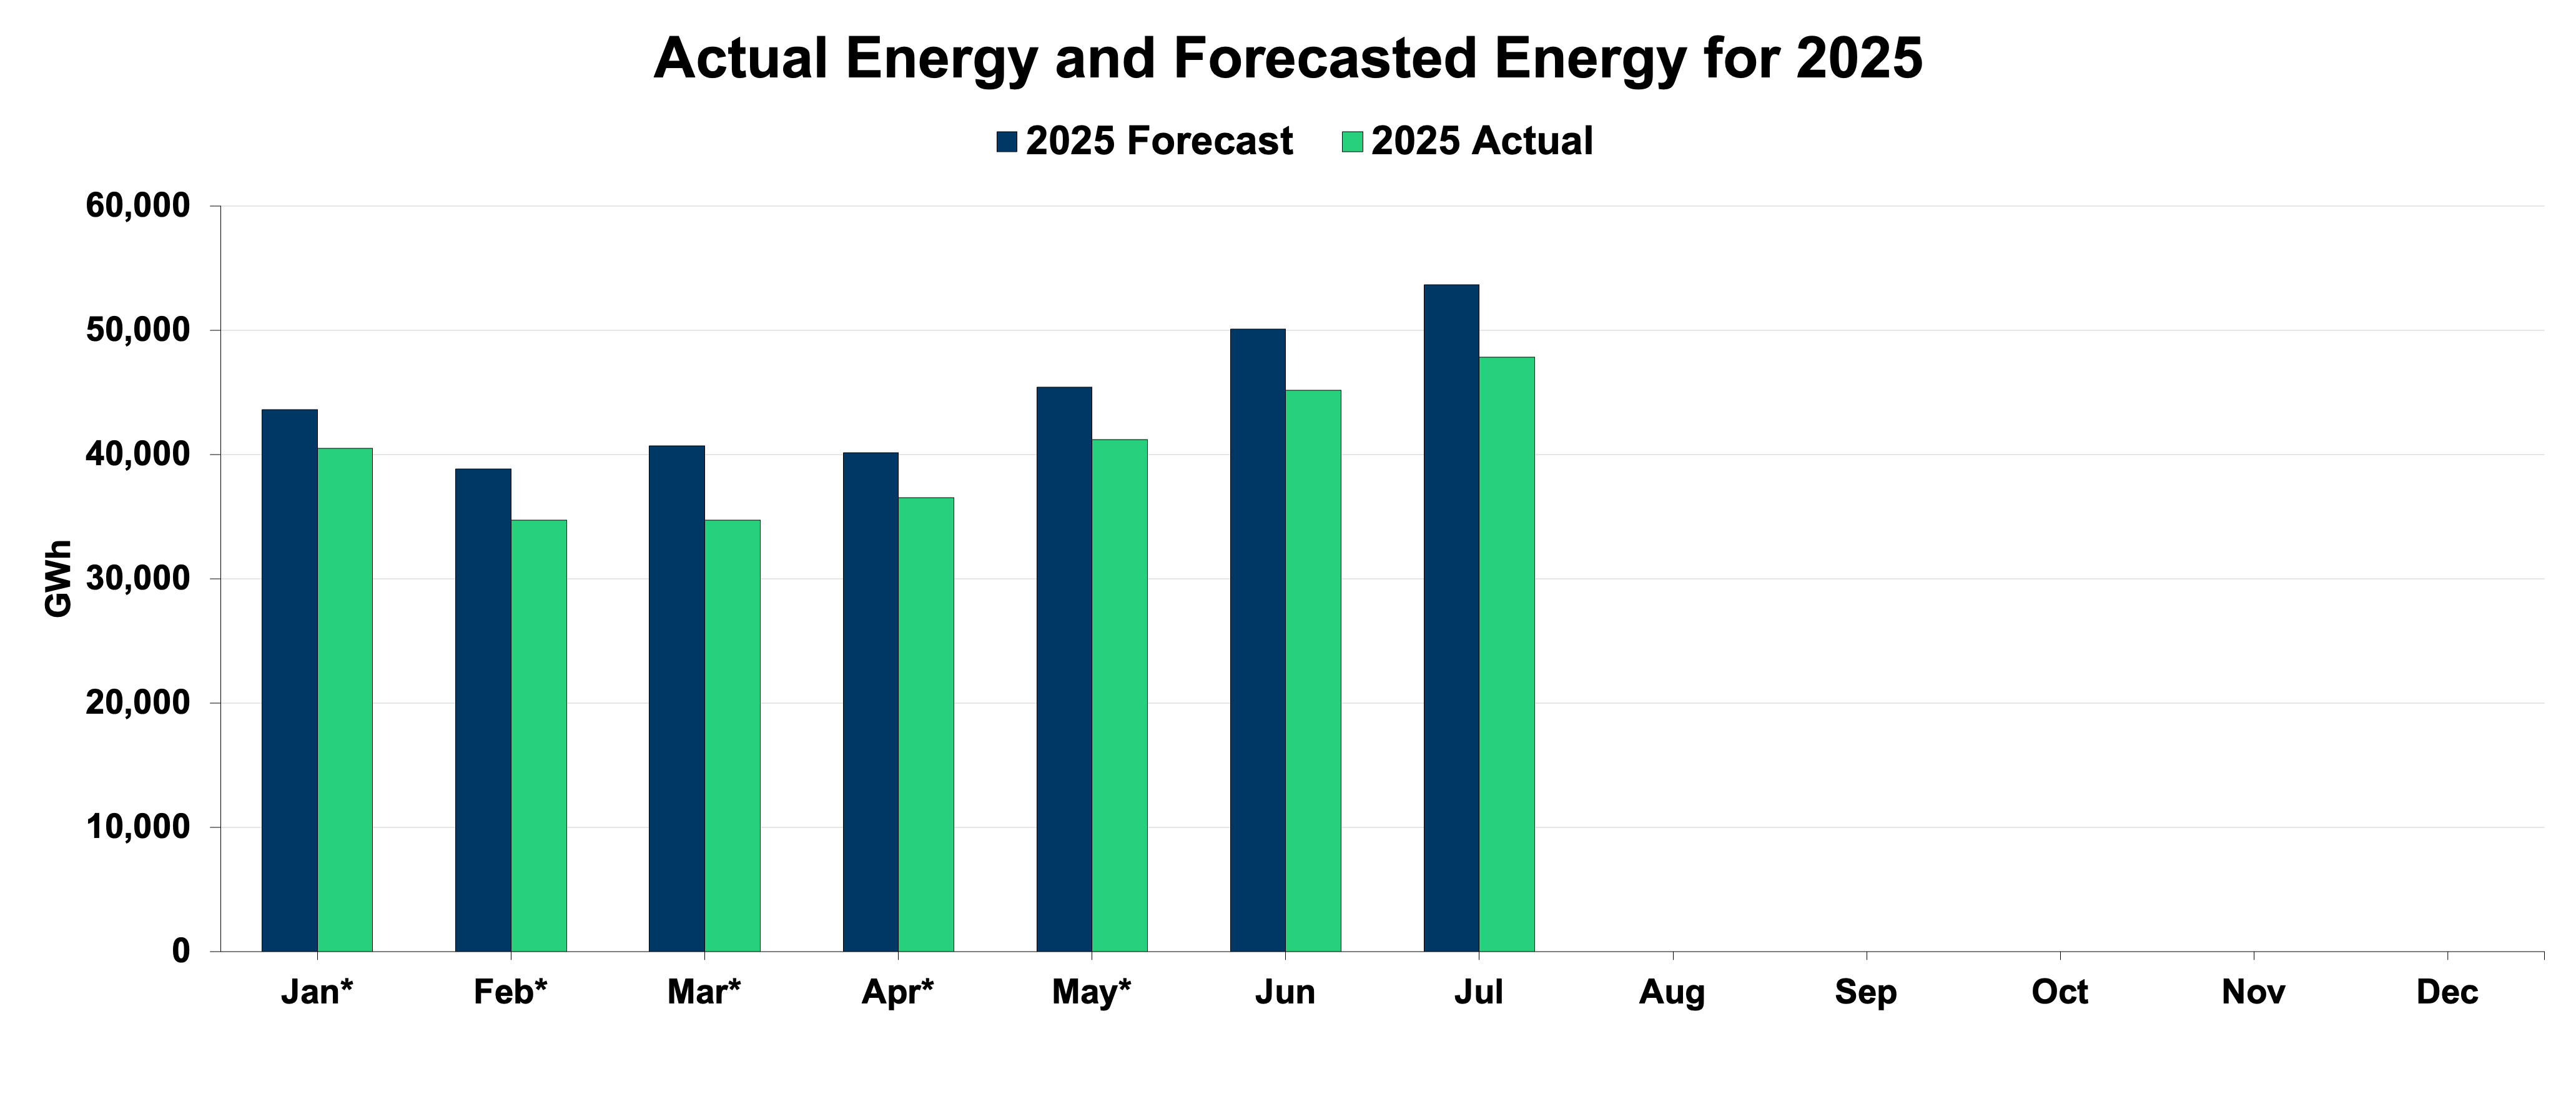
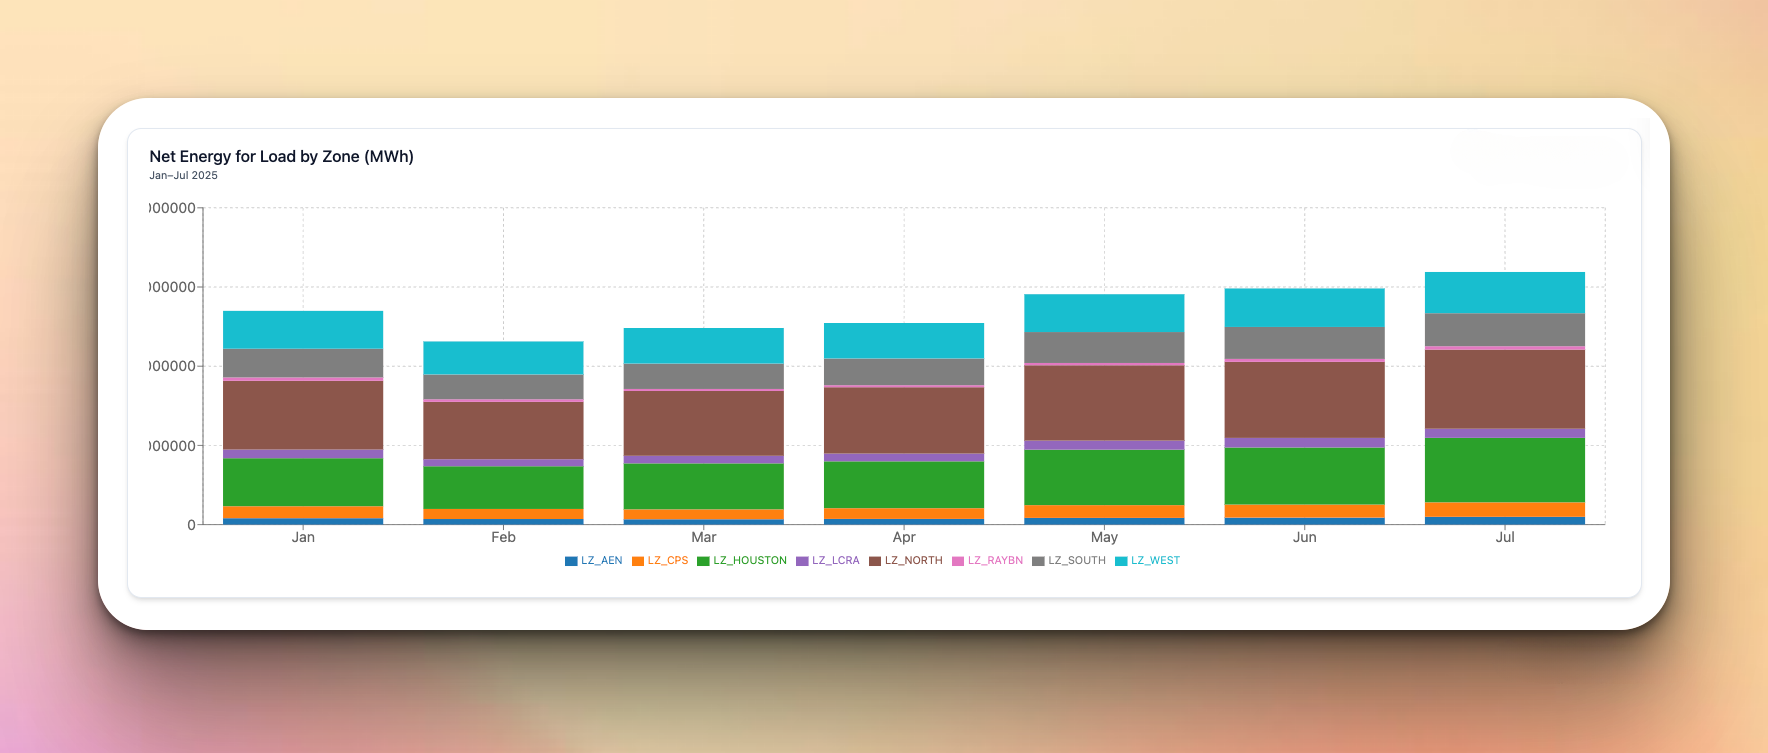
Actual net energy for load ran below forecast through much of spring. The gap narrowed into summer as heat persisted. July’s realized energy closed in on forecast as high temperatures and long ramps kept the system working into the evening. The story here is modelable. Winter is volatile and harder to forecast. Summer track is better as long as the weather follows a familiar path.
Two notes for planners:
Important to note that the following discussion is forward-looking and reflects observed market patterns, weather conditions, and operational data as of the publication date. It is not a formal forecast, nor should it be considered investment, trading, or operational advice. Market conditions in ERCOT can change rapidly due to weather, policy, fuel pricing, and system contingencies.
I frame the rest of the year in three cases. All assume the same structure: solar remains strong through early fall, wind improves in Q4, and gas carries the system across the evening.
Peaks: August clears 90 GW at least once. September tapers but still produces several scarcity-tinged evenings.
Prices: ORDC lifts early-evening hours in both months. On-peak month averages rise modestly.
Q4: October moderates. Wind rebounds in November and December. Scarcity risk shifts to cold morning peaks if a front lands before wind ramps.
Peaks: August tops out in the high-80s GW. September cools quickly.
Prices: Scarcity events fall off. DAM and RTM averages drift lower.
Q4: Winter fronts are short and scattered. System risk is manageable with current thermal fleet.
Peaks: Multiple August days in the 92–94 GW range. September stays hot.
Prices: Frequent evening ORDC adders and more congestion into coastal load centers. On a handful of days, RTM prints very high intervals when wind stays soft past sunset.
Q4: An early cold snap hits before morning wind picks up. A few scarcity intervals print in December mornings.
Probability today favors the base case. The high-demand case deserves a hedge plan because it stresses the same evening hours that are already tight.
- Treat scarcity as a series of repeatable, short windows instead of a single tail event. Structure around intraday spreads and 1–3 hour periods rather than only peak blocks.
- Focus on West-to-load-center congestion when wind is below forecast into a hot evening.
- Size August risk for a new system record, but do not overpay for all-day premium. The money sits in the ramp.
- Automate demand response between 4 pm and 8 pm on the hottest days. The ORDC uplift and LMP shape make those hours the highest value to curtail.
- Validate your CP detection logic. July showed that accurate 15-minute interval calls drive real savings. Arcus’ CP alignment with ERCOT at 0.04 percent difference is a solid benchmark for what accuracy must look like.
- Shift flexible processes earlier in the day during August and September. Midday solar dampens prices. Evenings do not.
- Pairing with storage is no longer optional for merchant risk. The revenue sits in evening discharge.
- Wind operators should plan around late-summer softness and target the Q4 rebound with maintenance timing and PPA delivery risk in mind.
- Solar operators can use midday shaping to secure a premium by firming into the first hour of the evening ramp.
- The market is paying for 2–4 hour capability most often, with a tail to 5 hours on the hottest days.
- Charge on solar-heavy hours. Discharge from 5 pm to 8 pm when ORDC is active.
- For August hedging, a simple rule works. If forecast wind is low and the max temperature is above 100 F in coastal load centers, hold more discharge for the final 90 minutes.
- Refit hedges to cover the cluster behavior. A strip of short-duration options around the evening window often outperforms a single peak block.
- Validate load forecasts against DR program participation. July’s measured curtailment impact shows you cannot assume forecast and reality match when programs engage.
- The thermal fleet, particularly gas-CC, remains essential for evening reliability.
- Storage additions that sit in the 4 to 6 pm bridge have outsized reliability value.
- Forecast communications should account for expected DR and behind-the-meter generation when peaks are likely. July’s 6.66 percent reduction is the case study.
ERCOT’s year to date looks calm on averages and busy in the details. Load climbed on schedule. Prices paid more attention to the evening bridge than to single-day extremes. Gas carried the heavy lifting when wind underperformed. Solar set records and kept midday in check.
July’s CP story is the real lesson. Forecasts called for a bigger peak. The combination of curtailment, DR, and behind-the-meter generation pulled it down by a measurable margin. That changed the peak, the pricing, and the narrative. Models that miss that behavior will miss the market.
All eyes move to August and September. Plan for a record attempt, run playbooks for short scarcity windows, and keep optionality for a handful of very hot evenings. That is where 2025 will be decided.
Explore our solutions to unlock market opportunities and manage risks effectively.
Get Started.png)
Shifting Assets For Data Center Energy Management

Arcus Power Announces Patrick Smith as VP of Technology to Accelerate AI Energy Innovation

Breaking down how Arcus’s high-probability approach made capturing IESO GA peaks possible